Understanding relationships between two different variables is a cornerstone of data analysis and critical thinking. A simple yet powerful tool for visualizing and exploring these relationships is the scatter plot. Scatter plots allow us to quickly identify trends and patterns, and more importantly, assess the correlation between the variables. A Scatter Plot Correlation Worksheet helps to solidify this understanding by presenting various scatter plot scenarios and challenging you to interpret the correlation present in each. It’s a fantastic resource for students, researchers, and anyone looking to improve their data literacy. This post delves into the concept of correlation, explains how to interpret scatter plots, and then provides the answers to a typical Scatter Plot Correlation Worksheet for your reference and self-assessment.
Interpreting Scatter Plots and Correlation
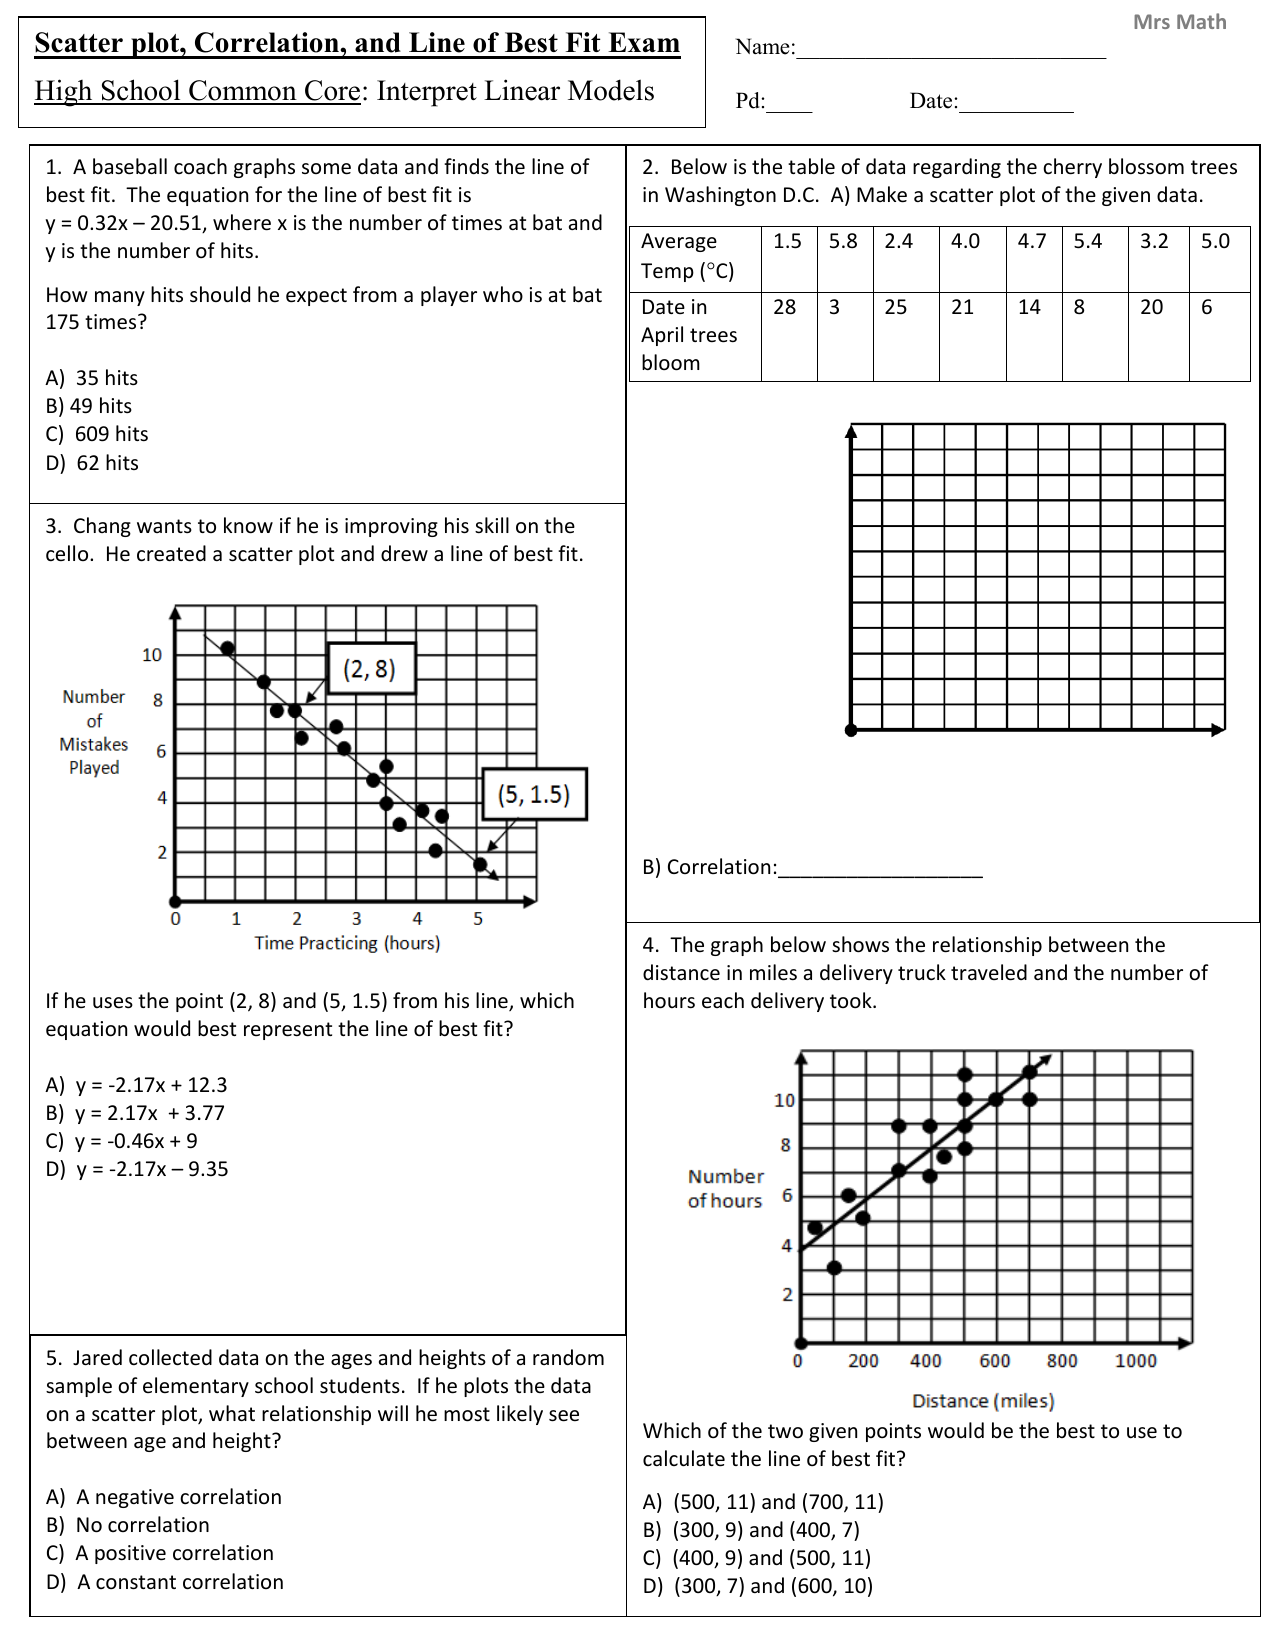
Before diving into the answers, let’s recap the basics of scatter plot interpretation and correlation. A scatter plot represents data points as dots on a graph. One variable is plotted on the x-axis (independent variable), and the other on the y-axis (dependent variable). By observing the overall pattern of the dots, we can infer the relationship between the variables. This relationship is known as correlation.
Correlation doesn’t imply causation! This is a crucial point to remember. Just because two variables are correlated doesn’t mean that one causes the other. There might be a lurking variable influencing both, or the relationship might be purely coincidental.
There are three main types of correlation:
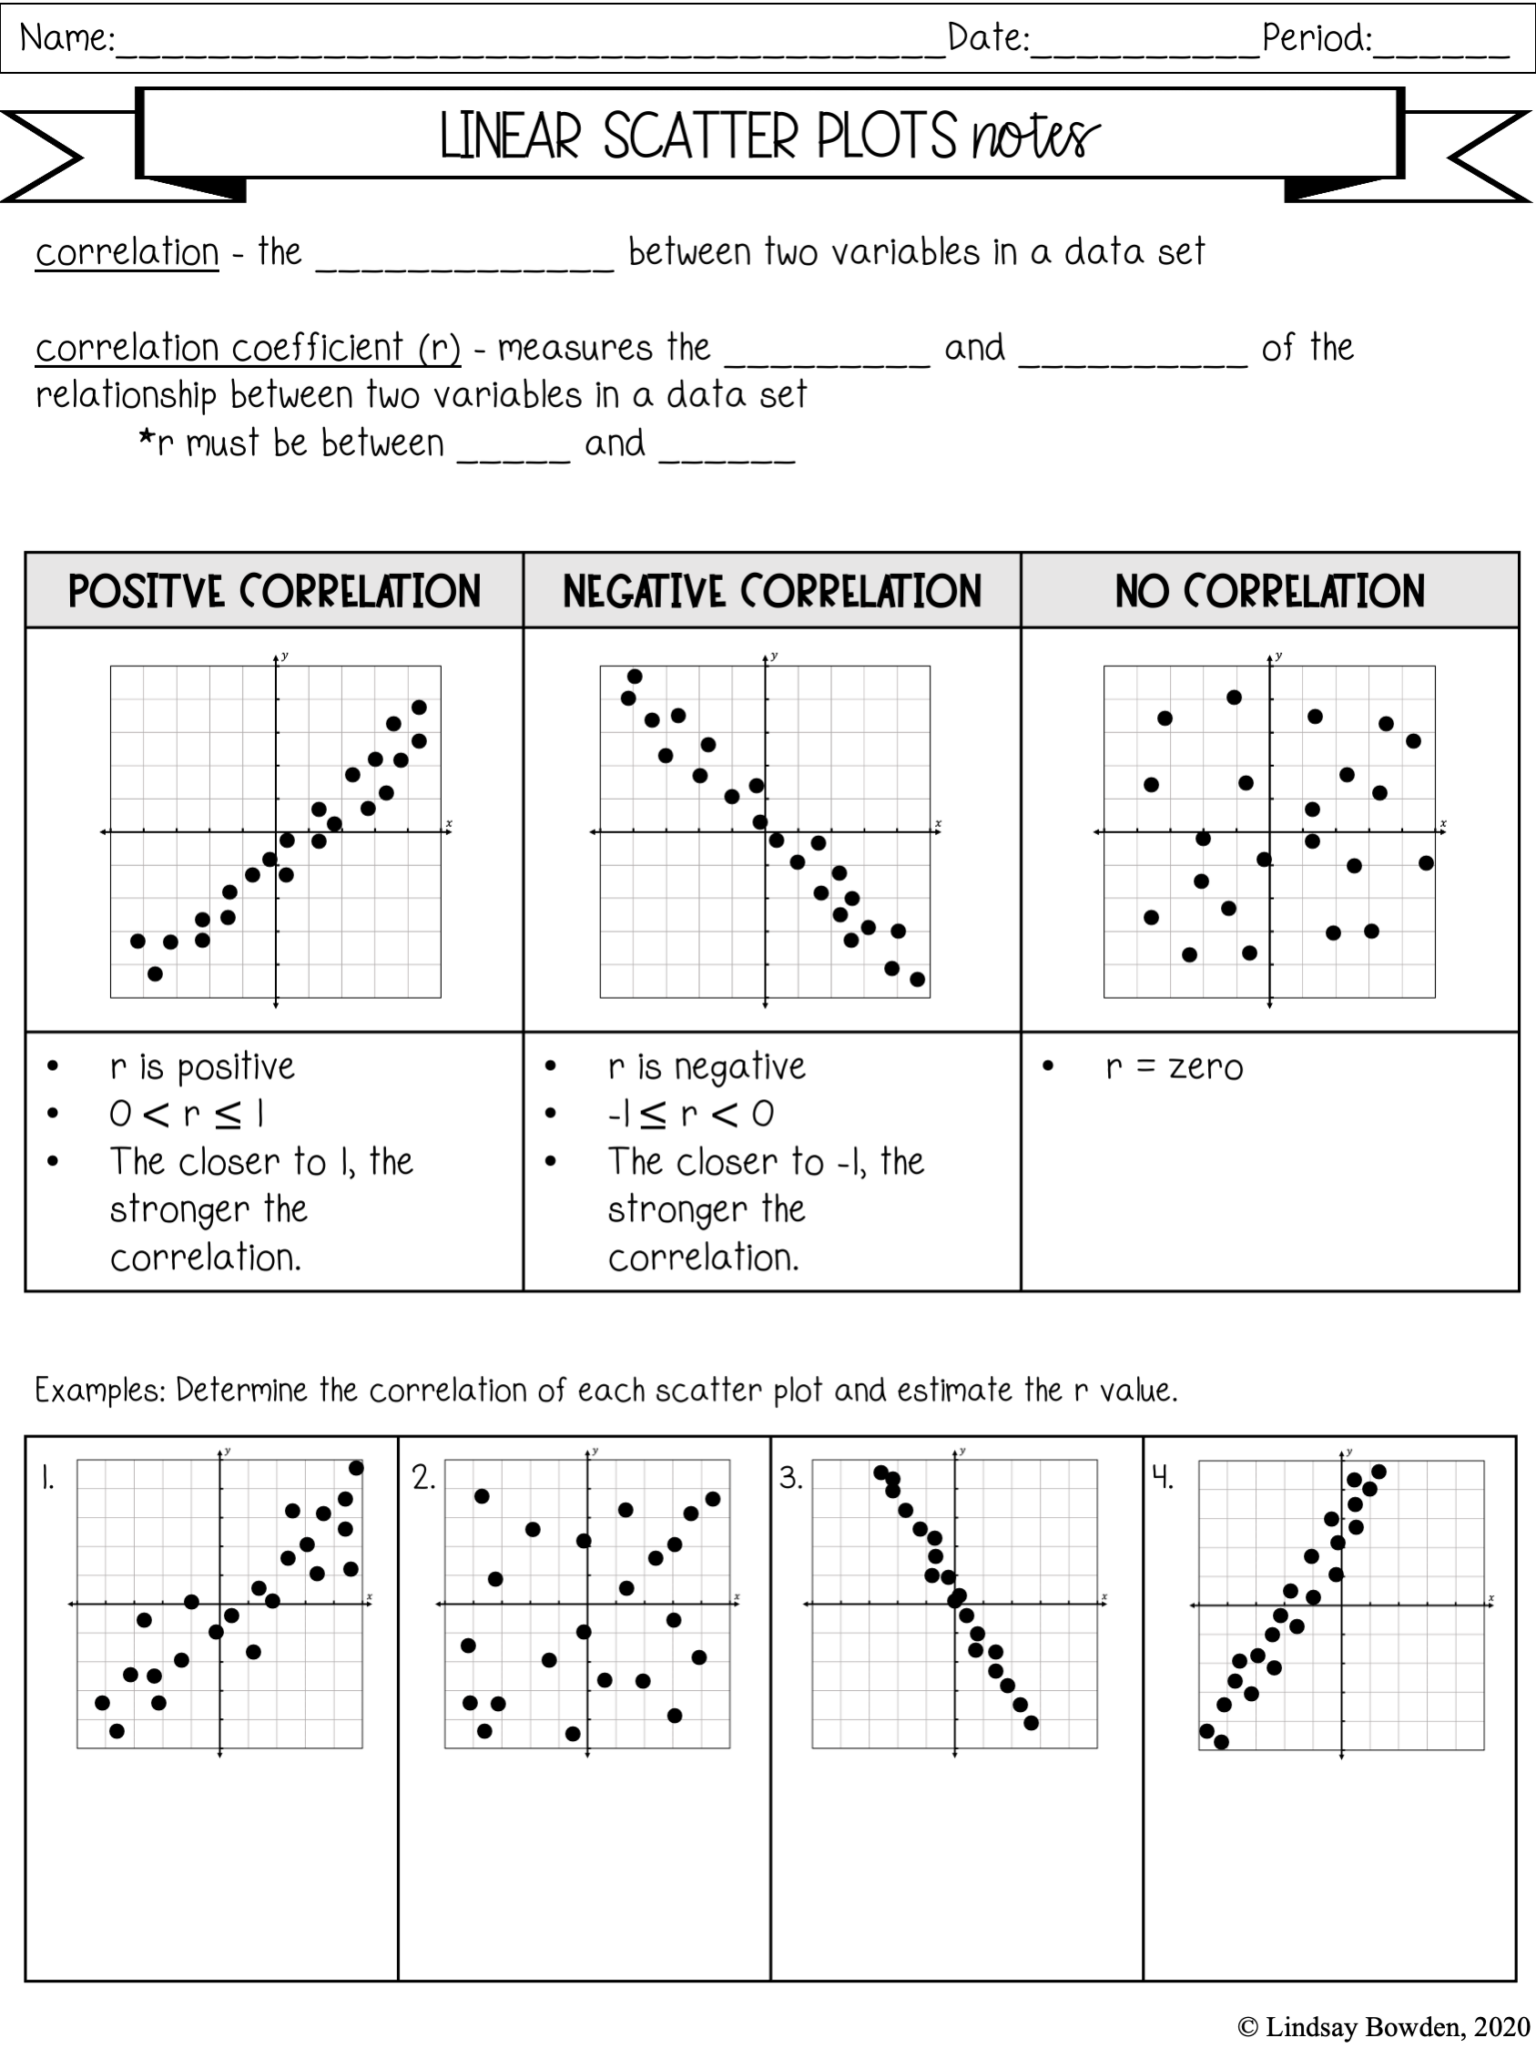
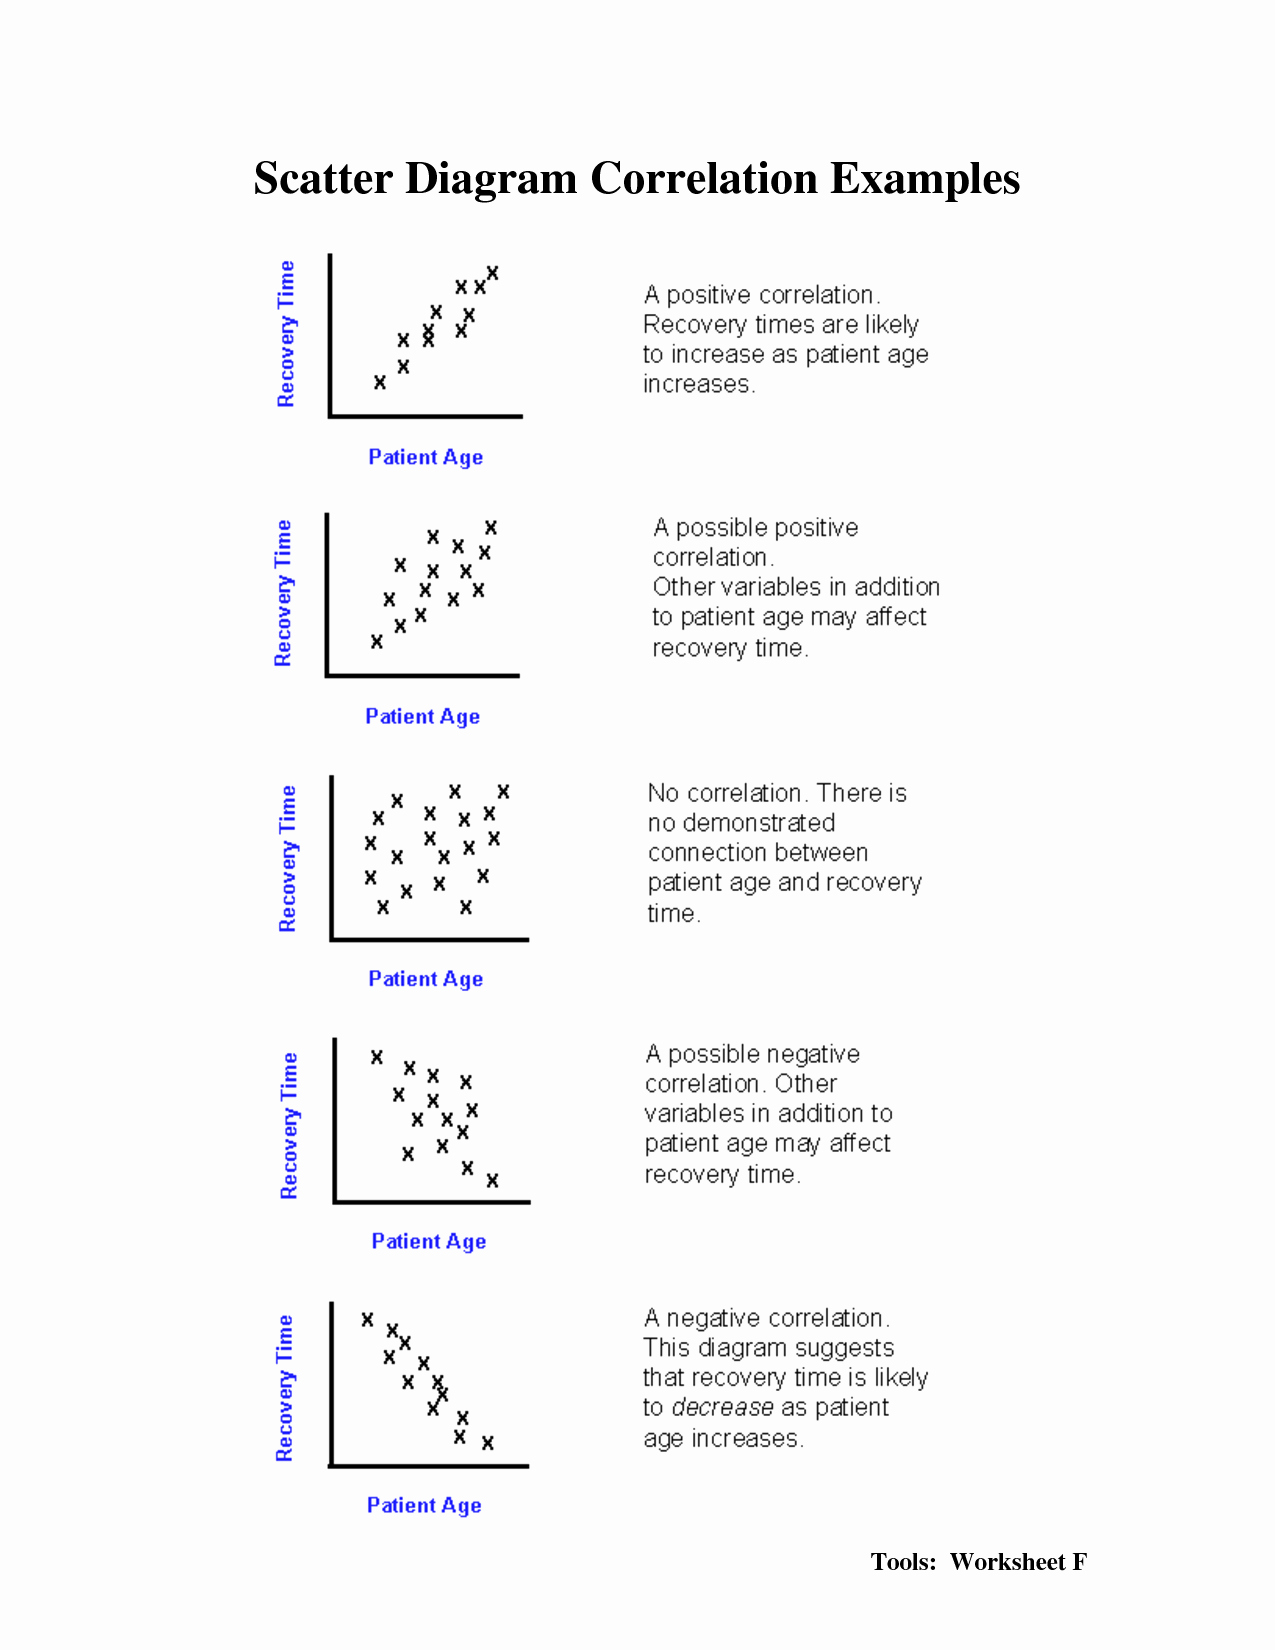
* **Positive Correlation:** As the value of one variable increases, the value of the other variable also tends to increase. The dots on the scatter plot generally trend upwards from left to right.
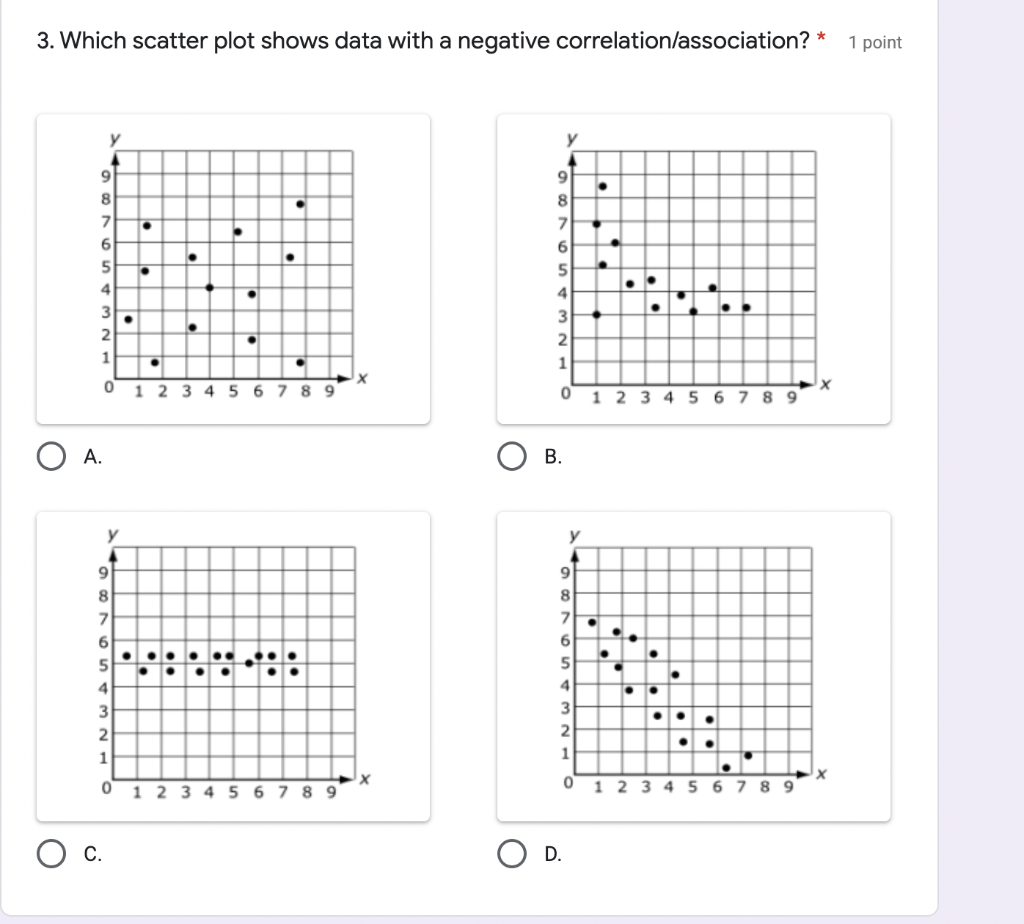
* **Negative Correlation:** As the value of one variable increases, the value of the other variable tends to decrease. The dots on the scatter plot generally trend downwards from left to right.
* **No Correlation:** There is no clear relationship between the two variables. The dots on the scatter plot appear randomly scattered with no discernible pattern.
We also describe the *strength* of the correlation. A strong correlation means the points are clustered tightly around an imaginary line (or curve). A weak correlation means the points are more scattered and the trend is less obvious. We can also describe a correlation as moderate, indicating a correlation strength somewhere between strong and weak.
Example Scatter Plot Correlation Worksheet Answers
Now, let’s assume a hypothetical Scatter Plot Correlation Worksheet consisting of descriptions of scatter plots. The task is to identify the type of correlation (positive, negative, or none) and the strength of the correlation (strong, moderate, or weak). Here are the described scatter plots and their corresponding answers:
Scatter Plot Descriptions and Correlations
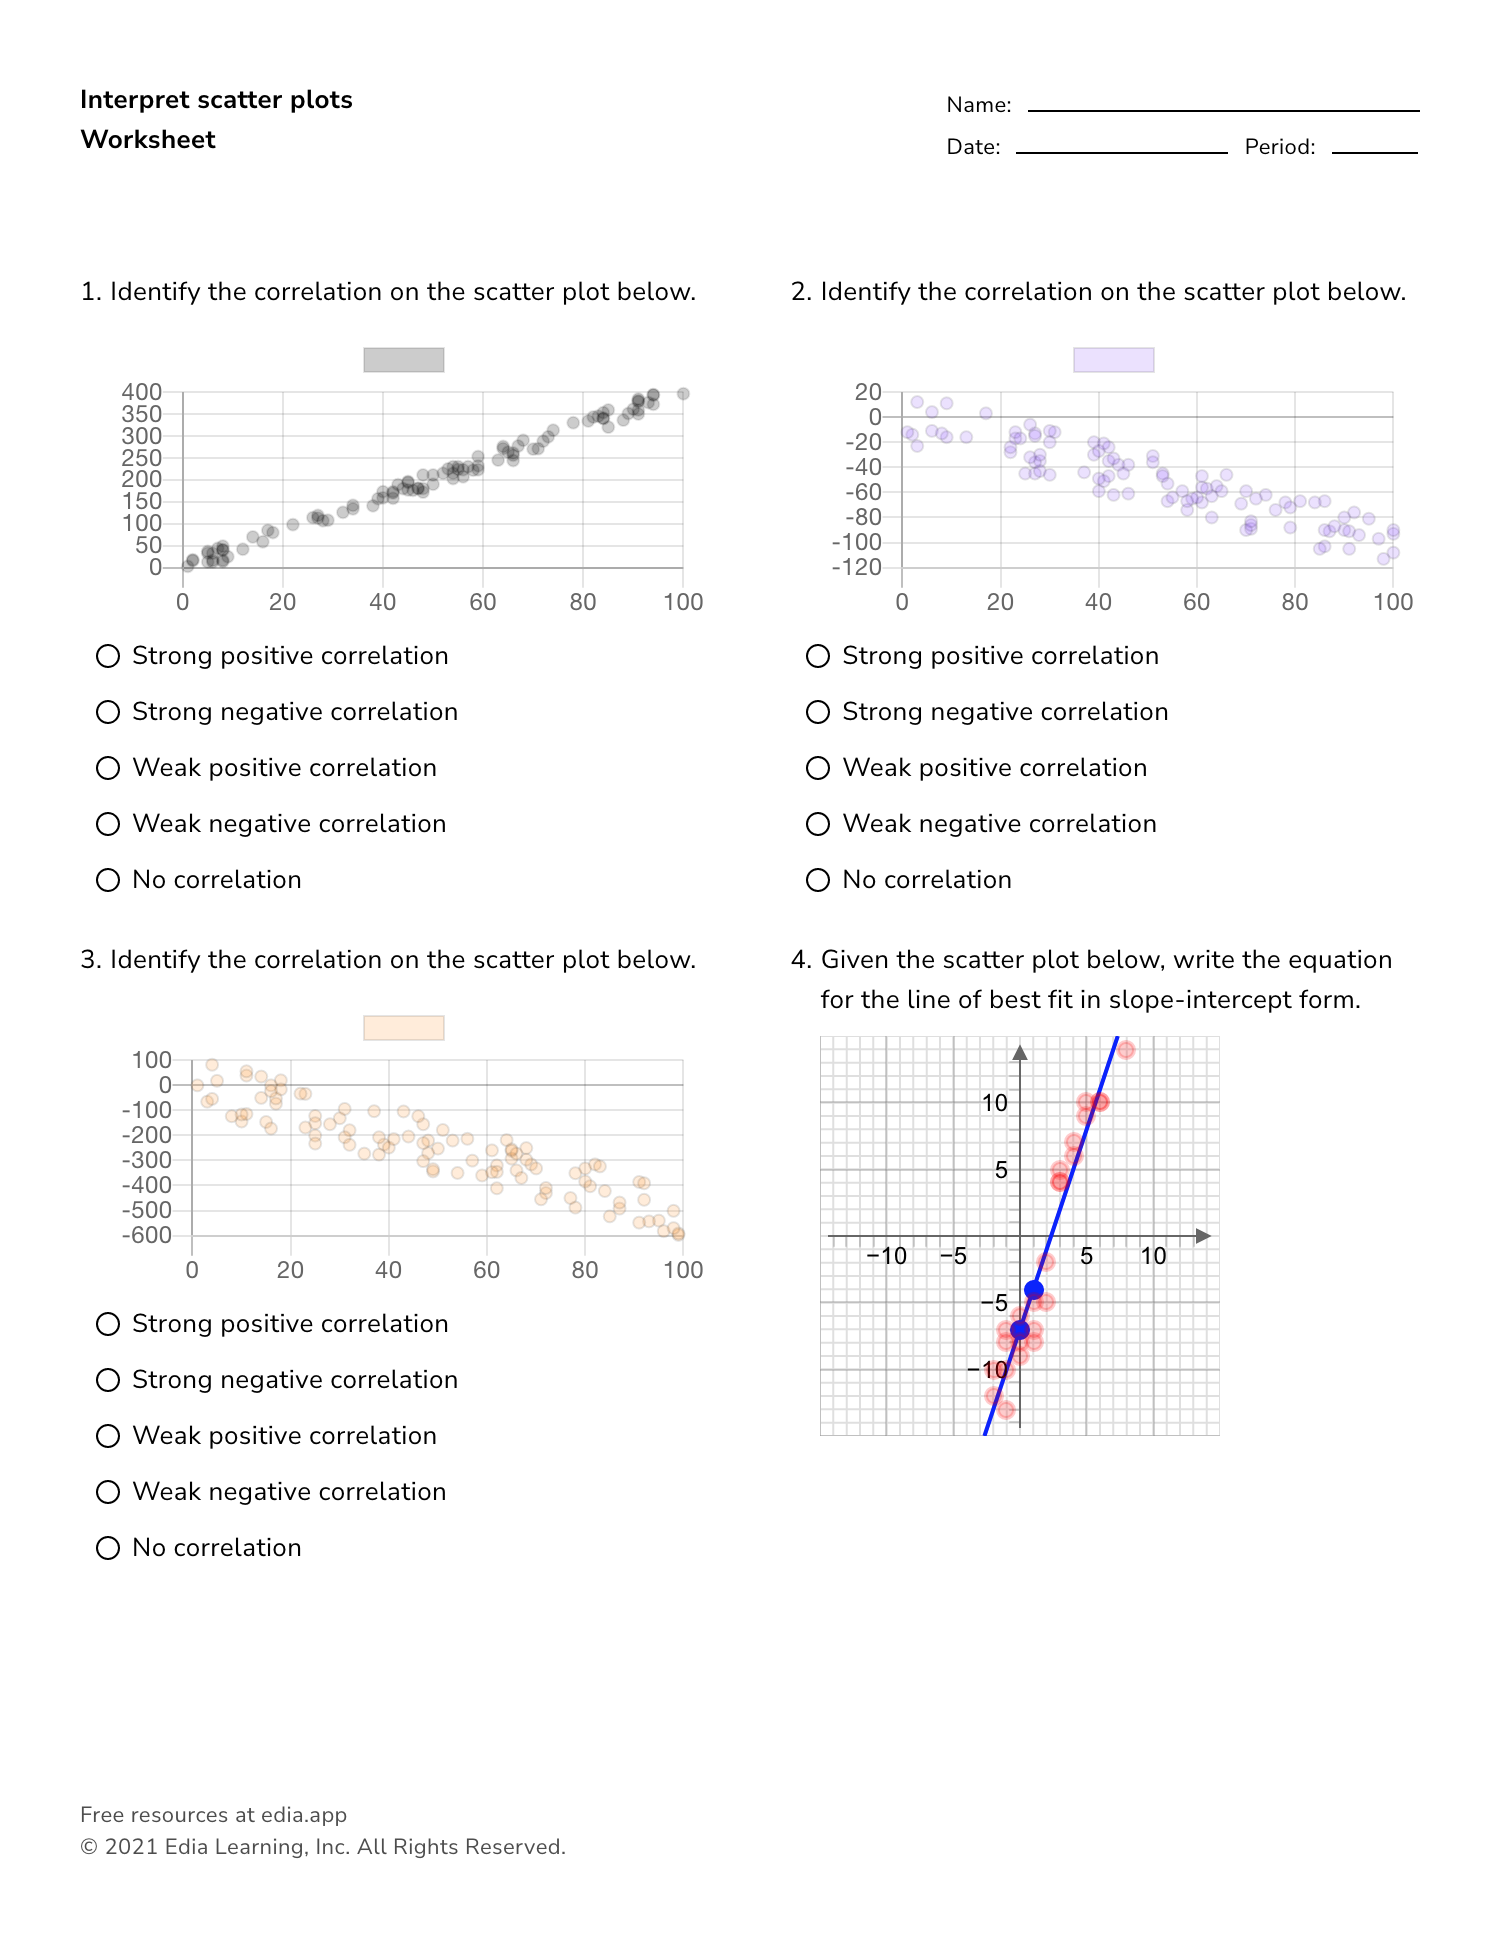
- Plot 1: The points are tightly clustered around a line that slopes upwards from left to right.
- Plot 2: The points are scattered randomly across the graph with no clear pattern.
- Plot 3: The points form a somewhat loose cluster around a line that slopes downwards from left to right.
- Plot 4: The points are closely grouped along a curve that initially rises sharply but then levels off.
- Plot 5: The points show a slight downward trend but are widely dispersed.
- Plot 6: As the x-value increase the y-values have no apparent pattern and stay mainly in one specific range.
- Plot 7: The values for the plot all lie exactly on a upward sloping straight line.
- Plot 8: The values for the plot all lie exactly on a downward sloping straight line.
Below is the list of the answers to the descriptions above:
- Plot 1:
- Correlation: Positive
- Strength: Strong
- Plot 2:
- Correlation: None
- Strength: N/A
- Plot 3:
- Correlation: Negative
- Strength: Moderate
- Plot 4:
- Correlation: Positive (Non-linear)
- Strength: Strong
- Plot 5:
- Correlation: Negative
- Strength: Weak
- Plot 6:
- Correlation: None
- Strength: N/A
- Plot 7:
- Correlation: Positive
- Strength: Perfect
- Plot 8:
- Correlation: Negative
- Strength: Perfect
By practicing with scatter plot correlation worksheets and consistently applying these principles, you’ll improve your ability to extract meaningful insights from data visualizations and make informed decisions based on observed trends. Remember that mastering data analysis is a continuous journey, and understanding correlation is a vital stepping stone along the way.
If you are looking for Constructing and Interpreting Scatter Plots Worksheet | Fun and you’ve visit to the right place. We have 22 Pics about Constructing and Interpreting Scatter Plots Worksheet | Fun and like Scatter Plot Correlation Worksheet – Pro Worksheet, Constructing and Interpreting Scatter Plots Worksheet | Fun and and also Worksheets On Line And Scatter Plot Graphs. Read more:
Constructing And Interpreting Scatter Plots Worksheet | Fun And

worksheets.clipart-library.com
Scatter Plots Worksheet | Live Worksheets – Worksheets Library

worksheets.clipart-library.com
Scatter Plot Correlation Worksheet – Pro Worksheet
www.proworksheet.my.id
Scatter Plots Notes And Worksheets – Lindsay Bowden – Worksheets Library

worksheets.clipart-library.com
Scatter Plot Correlation Worksheet – Pro Worksheet

www.proworksheet.my.id
Scatterplot Worksheet – Printable Word Searches

davida.davivienda.com
Scatter Plot Correlation Worksheet – Pro Worksheet
www.proworksheet.my.id
Scatter Plot Correlation Worksheet – Pro Worksheet
![]()
www.proworksheet.my.id
Worksheets On Line And Scatter Plot Graphs
learningzonebengtefs.z21.web.core.windows.net
Scatter Plots Worksheets Constructing And Interpreting Scatt

elbtunnelbdilessonmedia.z14.web.core.windows.net
Scatter Graphs Textbook Exercise – Corbettmaths – Worksheets Library

worksheets.clipart-library.com
Scatter Plot Correlation Worksheet – Pro Worksheet

www.proworksheet.my.id
Unit 4 Worksheet #1 Intro To Correlation Correlation: A To

worksheets.clipart-library.com
Scatter Plot Correlation Worksheet – Pro Worksheet
www.proworksheet.my.id
Scatter Plot Correlation Worksheet – Hilovertical
hilovertical.weebly.com
Scatter Plot Worksheets
printableschooljedburgh.z21.web.core.windows.net
Worksheet. Scatter Plot Correlation Worksheet. Worksheet Fun Worksheet

www.grassfedjp.com
Scatter Plots: Correlation Worksheet | PDF Printable Statistics

www.cazoommaths.com
Interpreting Scatter Plots Worksheet
lessonschoolsoleils.z14.web.core.windows.net
50 Scatter Plot Correlation Worksheet – Chessmuseum Template Library
chessmuseum.org
Ch07 Scatterplots, Association, Correlation, And Linear Regression

www.studocu.com
Scatter Plots: Line Of Best Fit Worksheet | 8th Grade PDF Worksheets

www.cazoommaths.com
scatterplot worksheet. Constructing and interpreting scatter plots worksheet. Scatter plot worksheets